A while back I bought an uninterruptible power supply (UPS) from CyberPower. I have a Linux workstation here at home that I need to keep safe from power outages.
CyberPower is kind enough to provide local monitoring and management software for Linux called PowerPanel that runs on the workstation and will shut it down appropriately if a power outage is detected and the battery back up is running low on battery power. Side note: this is not a paid advertisement, just being clear about the foundation for what I’m about to share.
It’s Friday. I like to learn new things on Fridays, especially playing with technology. Today I decided to see if I could monitor this UPS using Grafana Cloud. Disclosure: I work for Grafana Labs, makers of Grafana Cloud. In fact, I write documentation for Grafana Cloud, so trying novel use cases can only help me do my job better. Still, I found this to be fun and useful.
I run CyberPower’s monitoring software as a daemon on my workstation and don’t really think about it. We had a power outage last September and the battery worked perfectly and the daemon detected the conditions I set and powered down the workstation at the right time. I can also find the status of the UPS at any time. Here’s what that looks like from the command line, when I issued the pwrstat -status command just a few moments ago.
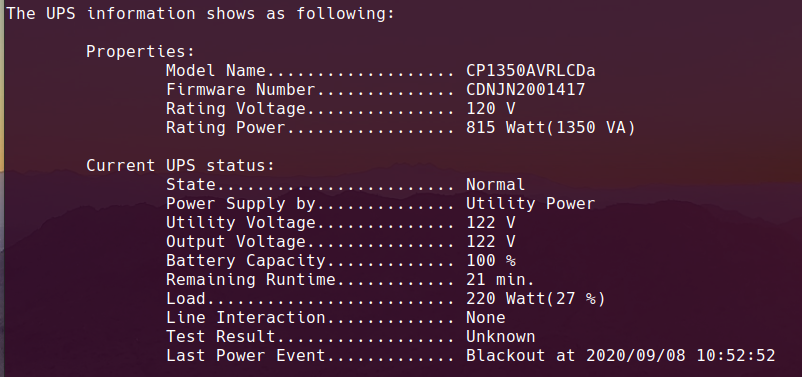
I had the thought last night that if I issued that command on a regular interval, I could collect time series data that I could graph over time. I could learn things like whether battery capacity fluctuates and when or what activities on the workstation create increased load on the UPS and by how much. That last one would require a bit of correlation of data outside of this blog post, but you get the idea.
I installed and configured Prometheus on the workstation to collect time series metrics. Metrics are quantitative measures commonly used for comparing and tracking performance over time. I had to figure out how to transform the output of that pwrstat command into a format that Prometheus could ingest.
Something I’ve discovered over the years is that I am rarely the first person to come up with an idea. I found Mike Shoup’s cyberpower_exporter on GitLab which he wrote for this exact purpose. Prometheus exporters are created to take metrics from a specific source and transform it into a standardized Prometheus format. This exporter works beautifully and now provides the Prometheus format metrics via HTTP on my local machine. Here’s an excerpt of that that output looks like in a browser.
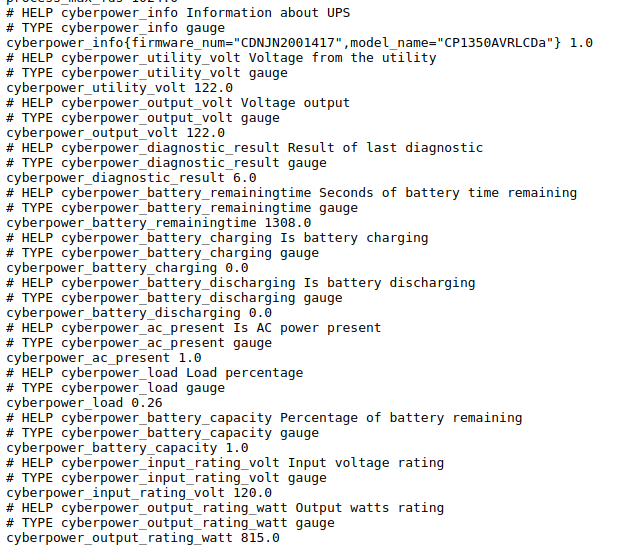
Cool! These metrics are gathered locally on the workstation multiple times per minute and stored in Prometheus on the workstation. Now, to ship those metrics off to Grafana Cloud.
Prometheus can be configured to send metrics to another location using a feature called remote write. To configure remote write to send my metrics to Grafana Cloud, I first had to sign up for a Grafana Cloud account and get it set up. I did that some time back, so today all I really had to do was edit the Prometheus configuration YAML file by inserting this code snippet, editing to include my Grafana Cloud username and in the place of a password, an API key.
remote_write:
        - url: https://prometheus-us-central1.grafana.net/api/prom/push
          basic_auth:
            username: {username}
            password: (APIkey}
I waited a few minutes and then used the Explore function in Grafana Cloud to confirm that the metrics were being received.
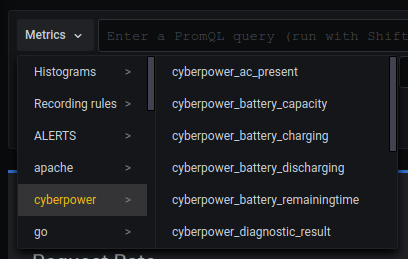
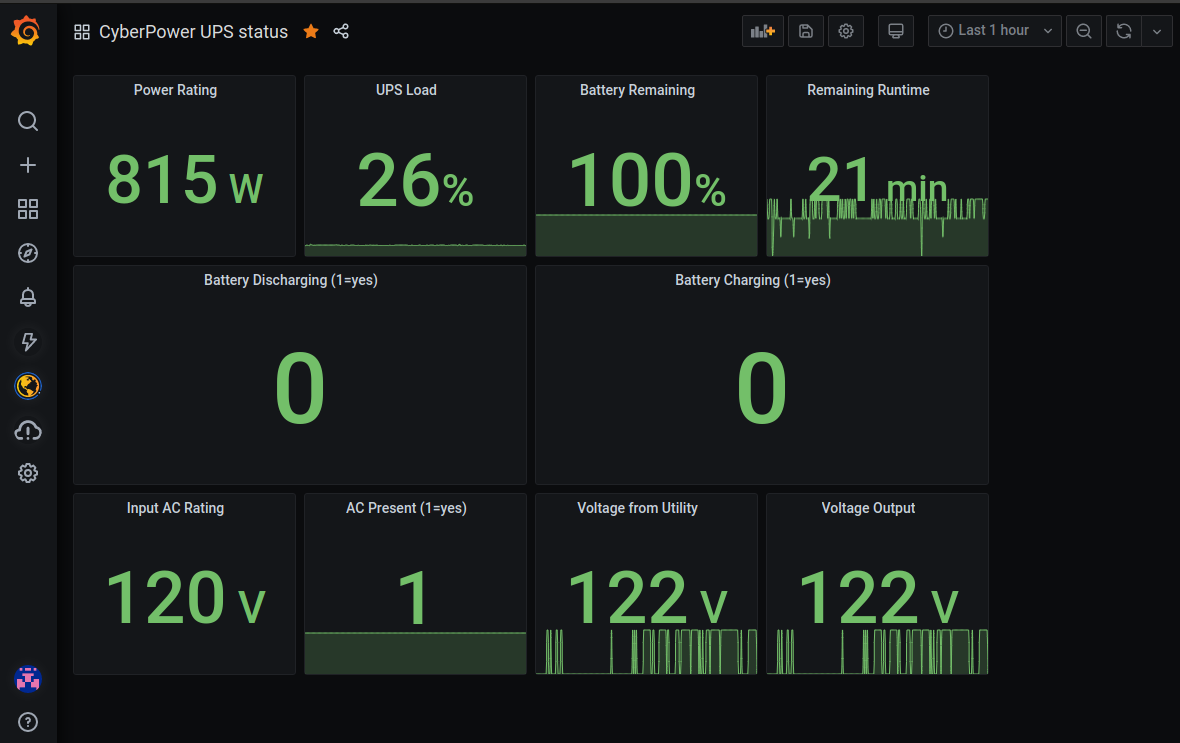
There they are! I tested a few queries to be sure. But, I’m still not done. I want a dashboard. That’s the whole point of this exercise. Honestly, I wanted to play with Thresholds, which among other things are useful for changing the color of a text or background of a panel in a dashboard depending on the value of a metric. This screenshot doesn’t show it, but if the value of any metric falls outside of parameters that I set, the panel (the box on the dashboard specific to that metric) will turn red. In addition, some of the metrics show a graph of that metric’s value over time so that I can see any fluctuations. This is useful.
This seems like a good use of a couple hours of my time on a Friday. I hope you agree.